GPS and budapester highflyers
GPS-data: summary 2010
By the start of the 2010 saison I had only one male left, which was the only candidate for having the GPS-device. It was not the best pigeon of the flock and all the others were breeding. The male was a late youngster of 2009 and during the flights it was always accompanied by young birds 2010. I lost the pigeon with the device during a flight in June. It never came back, despite the name-rings with my mobile number on it.
| Date | Interval (sec) | duration | total distance (km) | max. speed (km/u) | avg. speed | highest point (m) | max. dist. from loft (m) | nmbr of fixes |
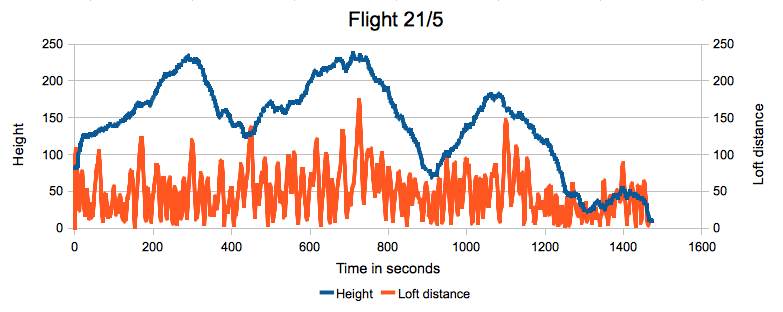
| 21/5 | 1 | 00:44 | 17.15 | 62.26 | 23.39 | 236 | 170 | 2630 |
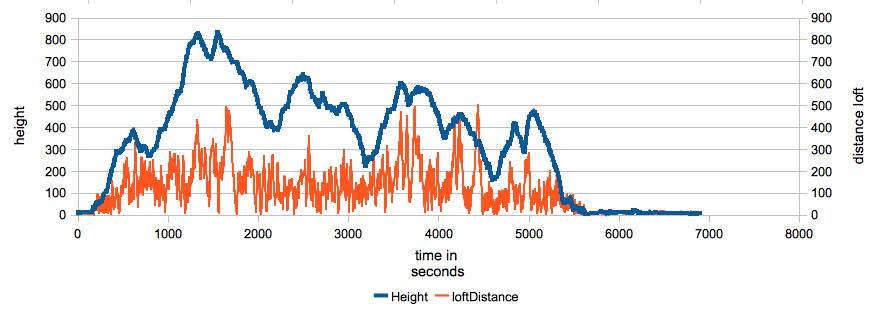
| 22/5 | 1 | 01:52 | 73.2 | 80.43 | 39.21 | 833 | 500 | 6770 |
| 23/5 | 1 | 02:15 | 91.3 | 72.47 | 40.58 | 583 | 1220 | 8122 |
| 24/5 | 1 | 01:34 | 45.22 | 75.82 | 28.87 | 329 | 330 | 5691 |
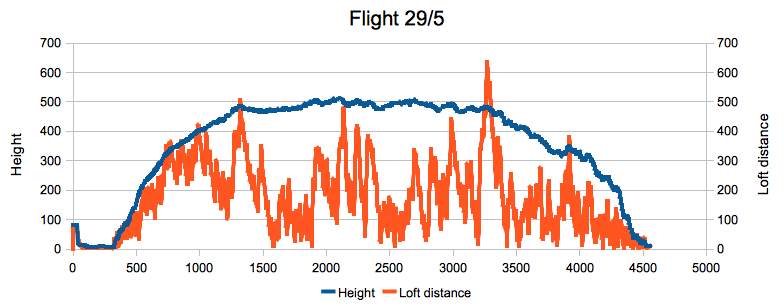
| 29/5 | 1 | 01:41 | 45:93 | 82.84 | 27.29 | 512 | 630 | 6069 |
| 3/6 | 15 | 00:36 | 9.19 | 71.23 | 15.32 | 204 | 310 | 602 |
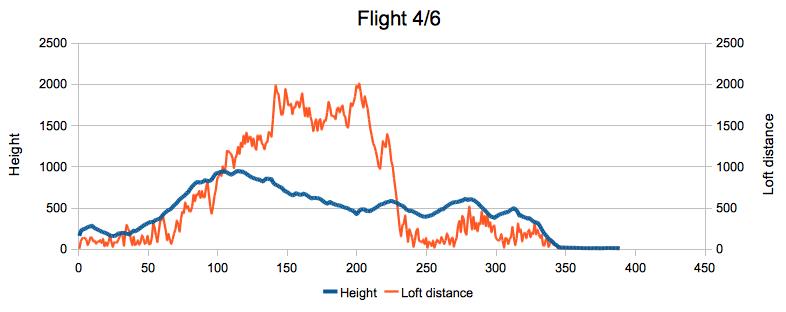
| 4/6 | 10 | 01:04 | 41.62 | 96 | 38.78 | 941.5 | 2000 | 389 |
| 5/6 | 10 | 00:26 | 7.43 | 59.24 | 17.15 | 279.49 | 210 | 159 |
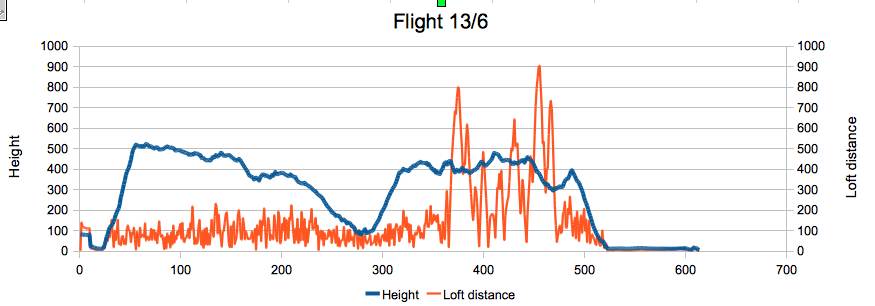
| 13/6 | 10 | 01:42 | 51.62 | 81.08 | 30.36 | 520 | 900 | 614 |
| 22/6 | 10 | 00:31 | 8.71 | 71.97 | 16.87 | 236 | 290 | 192 |
| 23/6 | 10 | 02:00 | 30.31 | 59.76 | 15.16 | 424 | 590 | 726 |
The above table summarizes all measurements from 2010. The values are less accurate then those of tipplers because I don't train them as strict as the tipplers. Sometimes budapesters stay on the roof of the loft while they shouldn't. Such a situation might influence average speed calculations. This was compensated by a self-developed software utility in an attempt to filter out such situations. Generally speeking, the results do not reflect the quality of the birds. During this part of the season my attention goes to the training of tipplers. Accurate training of my budapesters would certainly lead to better results in height and duration. A small explanation on the data:
- Interval: number of seconds between each fix (meaesurement). One second is far too much and generates too much data. 5 seconds is a good alternatif.
- Duration: in hours:minutes: from the moment they are released until they land (filtered out loft situation explained above)
- Total distance traveled during the flight; more accurate with a small interval.
- Maximum speed measured during the flight
- Average speed: there is much variation in the calculated data, for the reasons described above.
- Highest point: obviously an important point for highflyers. Depends on training and condition, and the birds populating the flock. The highest altitude measured is 940 m and quit impressive. I am convinced that they can go higher; see next season.
- Maximum distance from loft: distance measured from the fix to the loft position. There is often a correlation between the recorded height and the distance from the loft. The macimum distance was 2 km which is a lot for these birds (tipplers only go 600 m away from the loft). Budapester need more navigation skills to come back to the loft after when flying on heigh altitudes.
GPS-data: details
Let's look at the details of some flights. In the graphs below, the blue line represents the evolution of the altitude (left Y-axis). The distance from the loft is represented by the red line (right Y-axis). The red line is close to zero when the pigeon is close to the loft.
|
||
|
||
|
||
|
||
|
||
|
Flight movies
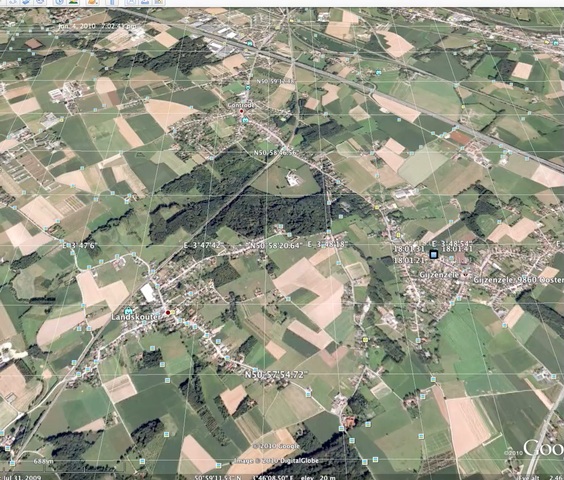
The charts above do not illustrate everything. Below are two movies made as screenshots from Google Earth which illustrate the flight pattern of a budapester pigeon. The flight starts at the loft, indicated by a flag. The dots represent the fix while the vertical lines give some feedback on the position relative to the ground.
This is the flight of May 22th with a maximum height of 833 m and a maximum distance of the loft of 500 m. GPS registration is done with an interval of 1 second, which is translated into a very fluent flight pattern on the screen.
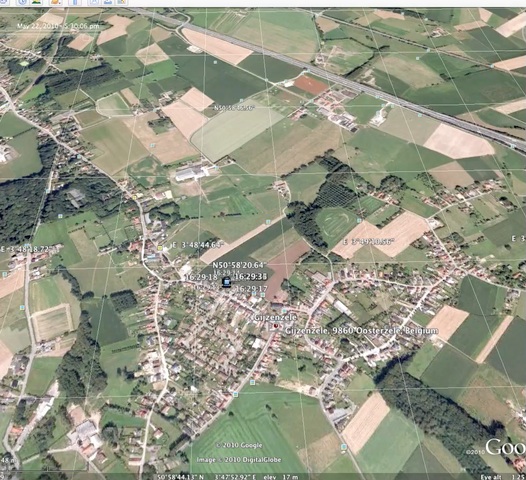
The second flight is the flight of June 4th with a maximum altitude of 941 m and a maximum distance from the loft of 2 km. The fix interval is 10 seconds.